The Age of Fort Worth
December 2, 2015
At the TCU Center for Urban Studies, we plan to produce data analyses and visualizations with open, public datasets that address urban issues in the Fort Worth and greater North Texas communities. Our first such example is an interactive building age map of Fort Worth, which we are calling The Age of Fort Worth. Please click the link below to access the map.
The Age of Fort Worth interactive map
The map shows all of the buildings in the City of Fort Worth’s publicly-available building footprint dataset (building outlines), colored by year of construction information from the Tarrant Appraisal District and the Denton Central Appraisal District. It is inspired by similar projects completed for Portland, Oregon, Los Angeles, and The Netherlands, among others.
Zoom and pan around the map to explore just like in Google Maps, hover your cursor over any building to reveal its address and year of construction in the top-right corner of your screen, and locate your computer or device on the map by clicking the pin icon in the top-left corner. If you are interested in the technology behind the development of the map, please click this link for the companion technical write-up.
There are countless stories in the map about Fort Worth neighborhoods; feel free to explore and find those relevant to you! We’ve highlighted a few of these stories below.
Tear-downs and re-builds in Monticello
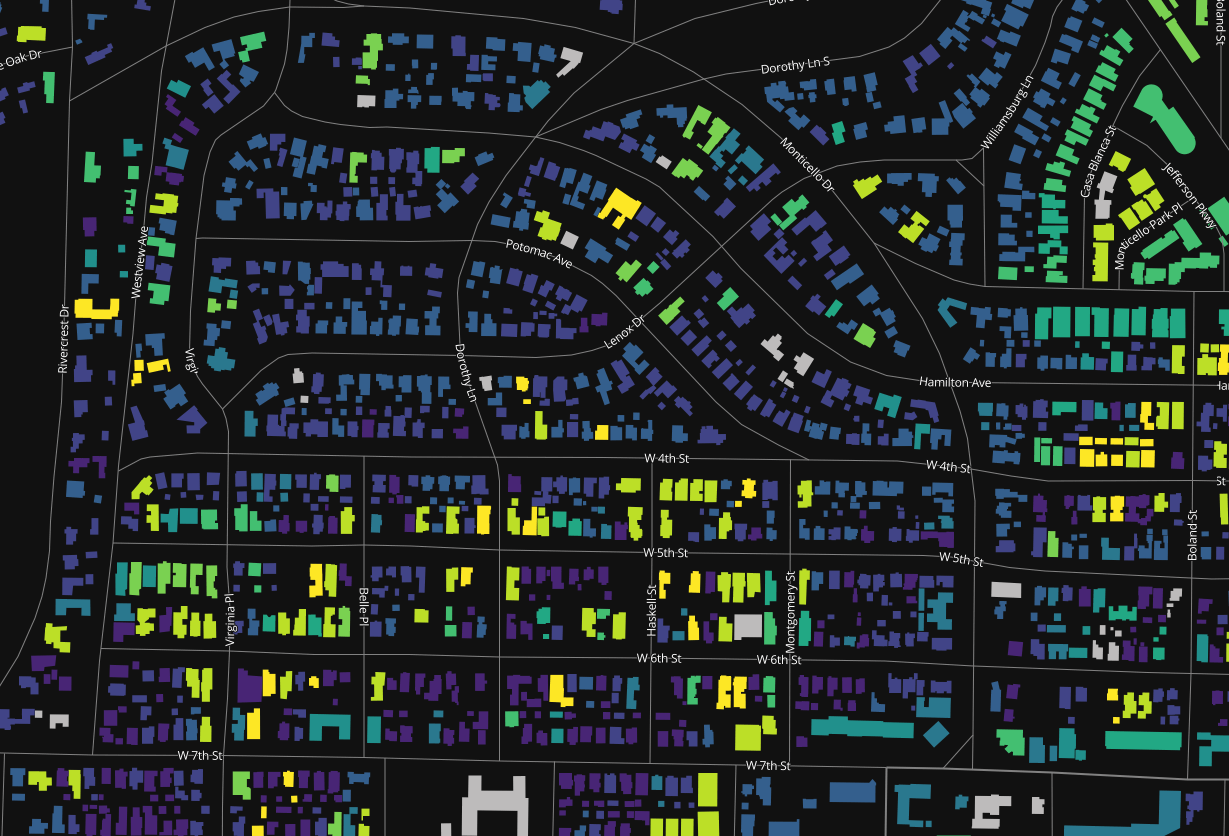
The Monticello neighborhood is located in west Fort Worth, just to the northwest of the popular Cultural District and West 7th Street areas. In recent years, many older houses in Monticello have been torn down, making way for newer construction in the neighborhood. In 2007, the Fort Worth Weekly reported on this activity in Monticello; this has continued apace since 2007, as revealed by the map. On many streets in Monticello, it is common to see a home constructed in the 1920s next door to a new build from the past five years.
Re-development in the Terrell Heights Historic District
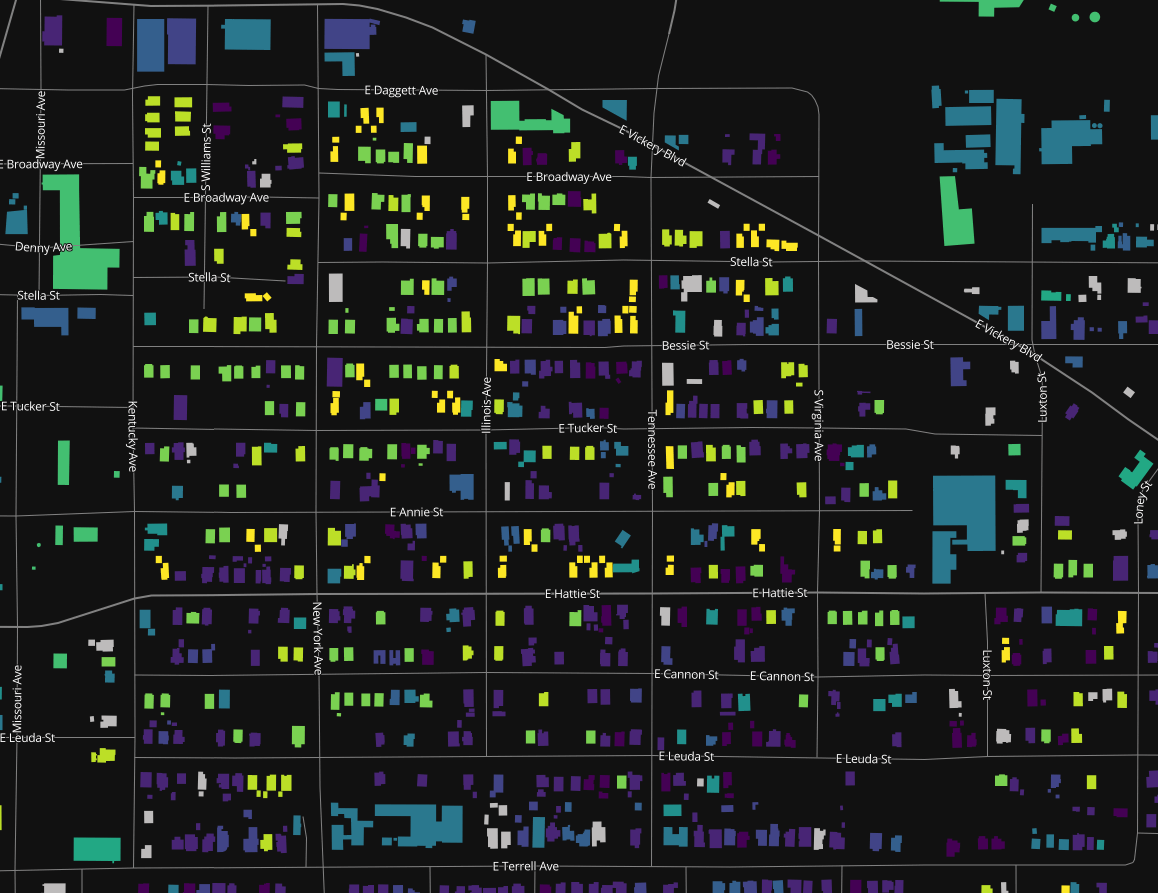
The Terrell Heights Historic District (also called the Historic Southside), located to the southeast of Downtown Fort Worth, also has experienced significant redevelopment over the past decade. Thanks to both private partnerships and federal and state grant funding, the City has pursued both commercial and affordable housing development in the neighborhood, as detailed in this 2012 article in the Fort Worth Star-Telegram. The new developments in Terrell Heights are highlighted in green and yellow on the map, showing that majority of buildings on many blocks in the neighborhood have been constructed since the late 1990s.
Pre- and post-recession growth in Far North Fort Worth
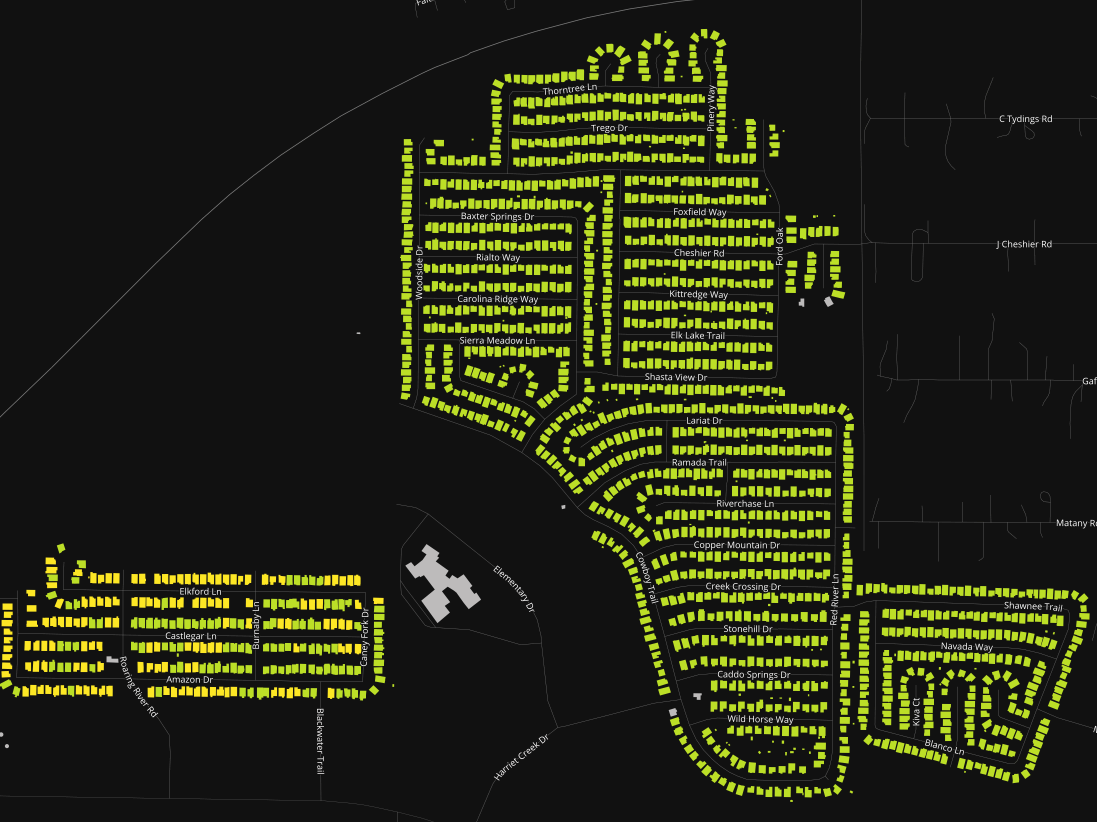
The northern-most neighborhood in Fort Worth is Harriet Creek Ranch, located in Denton County to the west of Texas Motor Speedway. Like many other neighborhoods on the edges of Fort Worth, Harriet Creek Ranch was built almost entirely in the early 2000s before the recession of 2008 and 2009. The “waves” of development in these neighborhoods pre- and post-recession are visible on the map, with post-2010 development represented in bright bright yellow. An example is the Rivers’ Edge West neighborhood just west of Harriet Creek Ranch, the cluster of homes on the left-hand side of the image.
What about other cities in the Fort Worth area?
Our goal with this map is to demonstrate an “open data” workflow, in which all of the datasets and tools used to produce the map are free to the public. Building footprint data are available for purchase from the North Central Texas Council of Governments; as such, we opted to focus on Fort Worth, as the City provides footprint data for free. This is why you’ll see open spaces on the map with no buildings; there are buildings located in these areas, but they are not part of the City of Fort Worth. We’ve labeled those other municipalities on the map (e.g. Edgecliff Village, Westover Hills).
Is the map accurate?
The map is as accurate as the underlying data from the City of Fort Worth and the Tarrant and Denton Appraisal Districts. However, in any dataset as large as this one, some inconsistencies are likely to creep in. While the map uses the most recent data available, some very new (since 2014) construction in Fort Worth may be omitted. Also, we cross-checked a random sample of building ages in our dataset against the corresponding information from Zillow, and found that they matched 94 percent of the time, and that half of the mismatches were within 10 years of one another. Some of the errors, however, are due to the way that buildings are classified by the Tarrant Appraisal District. Take the western part of TCU’s campus, for example, in which every building has a “year built” value of 2011, even though many of the buildings are much older:
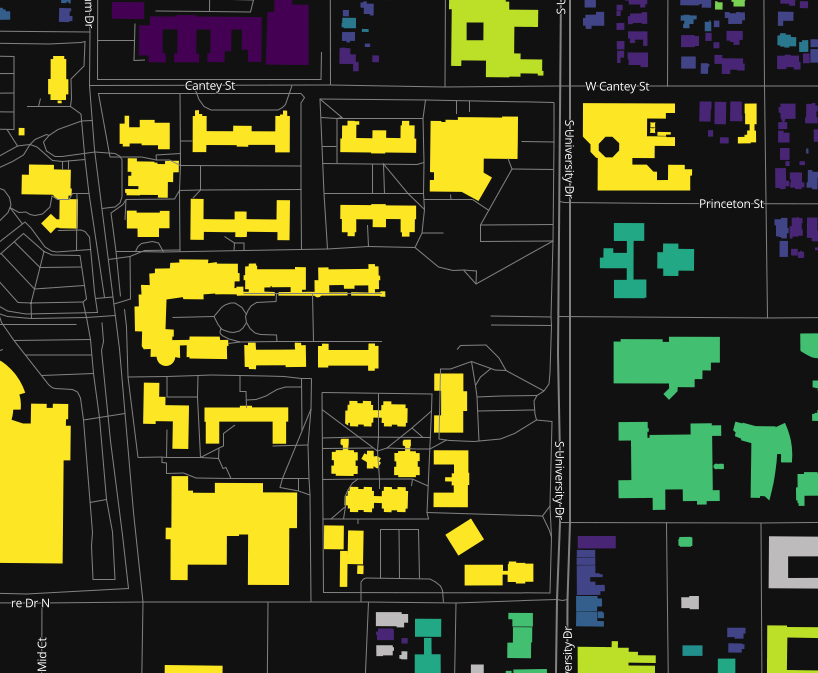
All of these buildings are on the same Tarrant Appraisal District parcel, have the same address in the database (2820 S University Dr), and in turn all have the same ID code. In turn, when the year of construction information is updated in the TAD dataset for a new building, all the TCU buildings will be updated in turn. Additionally, you may come across some missing buildings; for example, the building that houses the Center for Urban Studies on TCU’s campus, Scharbauer Hall, is missing from the City’s building footprint dataset.
We hope you enjoy exploring the map, and please keep an eye out for our future posts!